YOLOv5 v7.0 release updates #10245
YOLOv5 v7.0 release updates #10245
Conversation
Signed-off-by: Glenn Jocher <glenn.jocher@ultralytics.com>
Signed-off-by: Glenn Jocher <glenn.jocher@ultralytics.com>
Signed-off-by: Glenn Jocher <glenn.jocher@ultralytics.com>
|
@AyushExel @Laughing-q @taliabender @AlanDimmer @pderrenger new YOLOv5 v7.0 splash images for release tomorrow Tuesday the 22nd. |
|
@glenn-jocher If our models are current SOTA, should we have this kind of chart for segmentation also in the collapsible section? |

|
@AyushExel would be nice but putting the comparison plot together is a significant undertaking. The EfficientDet speeds and accuracies I gathered from their repo rather than actually running the tests myself. |
|
@glenn-jocher ok got it!
|
|
@Laughing-q do you think you could help create a comparison graph that what @AyushExel is showing above? You could do this on any GPU, or if you have a script I could run this on our A100 instance also. EDIT: If you send me the data I can also plot it. The current plot is generated by: Lines 356 to 357 in be348cc
|
|
@glenn-jocher @Laughing-q |
Signed-off-by: Glenn Jocher <glenn.jocher@ultralytics.com>
|
@AyushExel you think we could just edit the leaderboard? |

|
@glenn-jocher I don't know 🤷♂️ , Creating an account now to see. |
|
@glenn-jocher Ok! looks like I can edit it. We should add L-seg or X-seg model? |

Signed-off-by: Glenn Jocher <glenn.jocher@ultralytics.com>
|
@AyushExel wow, I didn't realize it was that easy to edit the leaderboard. Maybe there's a review process. I updated README segmentation section with your two changes, can you take a look? Technically our x model should also be realtime, i.e. it's 4.5ms inference + about 1ms NMS for TRT FP16 on A100 at batch-size 1 --img 640. |
Signed-off-by: Glenn Jocher <glenn.jocher@ultralytics.com>
|
@glenn-jocher okay looks perfect 👍 Btw what should be the inference speed in FPS for X-seg model? Converting from ms/frame to FPS, It should be 1000/4.5.. Seems too high right? |

|
@AyushExel ya seems pretty fast, but we are using a fast GPU. I'd add the 1ms NMS just to play it safe, 1000/5.5 = 182 FPS |
|
@glenn-jocher I think so. The field self-populates with options and you need to choose one from the drop-down. I guess it's reading from arxiv |
|
TODO: update download scripts to point to v7.0 |
ok, got it. So we probably want to show other one or two models in our chart, like |
|
@glenn-jocher @AyushExel okay I believe we can easily get the tensorrt speed and torch-speed of yolov5-seg, I'll try to export SparseInst and maYOLACT to tensorrt and compare the speed. |
@Laughing-q I think if we can't calculate the speeds ourselves then it's fine to use it from the chart. Not sure about the detection speed but the segmentation chart mentions TRT so I think Glenn used tensorrt for that. |
Ok perfect. If we can't get speeds for some, we can just take them from the charts |
|
@glenn-jocher @AyushExel Actually I can't smoothly export
The plot script is here, also the speed and mAP are in the following code: import matplotlib.pyplot as plt
yolov5_seg = dict(
N=dict(speed=4.0, mAP=27.6),
S=dict(speed=4.9, mAP=31.7),
M=dict(speed=9.4, mAP=37.1),
L=dict(speed=14.0, mAP=39.9),
X=dict(speed=24.1, mAP=41.4),
)
sparseinst_640max = dict(
r50vd_dcn_giam=dict(speed=16.5, mAP=35.5),
r50vd_giam=dict(speed=15.9, mAP=34.0),
r50vd=dict(speed=15.5, mAP=32.58),
)
sparseinst_640min = dict(
r50vd_dcn_giam=dict(speed=26.4, mAP=37.7),
r50vd_giam=dict(speed=25.3, mAP=35.6),
r50vd=dict(speed=24.7, mAP=34.1),
)
solov2_640max = dict(
r50=dict(speed=31.7, mAP=28.9),
r101=dict(speed=37.5, mAP=31.14),
)
solov2_640min = dict(
r50=dict(speed=44.7, mAP=32.5),
r101=dict(speed=54.5, mAP=34.8),
)
colors = ["#1f77b4", "#ff7f0e", "#2ca02c", "#7E2F8E", "#A2142F"]
names = ["yolov5-seg", "sparseinst_640min", "sparseinst_640max", "solov2_640min", "solov2_640max"]
results = [yolov5_seg, sparseinst_640min, sparseinst_640max, solov2_640min, solov2_640max]
for i, result in enumerate(results):
plt.plot(
[value["speed"] for _, value in result.items()],
[value["mAP"] for _, value in result.items()],
"*-",
linewidth=2,
markersize=8,
label=f"{names[i]}",
color=f"{colors[i]}",
)
for k, v in result.items():
plt.text(
v["speed"],
v["mAP"],
k,
fontsize=15,
# style="italic",
weight="light",
# verticalalignment="center",
horizontalalignment="right",
# rotation=45,
color=f"{colors[i]}",
)
plt.grid(alpha=0.5)
plt.xlabel("Torch-FP16 Latency(ms) on RTX3060")
plt.ylabel("COCO AP val(%)")
plt.legend(loc="lower right")
plt.show()
# plt.savefig("result_new.png") |

|
@Laughing-q wow, super awesome!! Ok I'm taking a look at this now and I'll update the Release notes with it before I do the release later today. |
|
Ok I've updated it a bit, looking amazing! I'm going to include this version in our release notes and in the readme.
import matplotlib.pyplot as plt
import numpy as np

yolov5_seg = dict(
    YOLOv5n=dict(speed=4.0, mAP=27.6),
    YOLOv5s=dict(speed=4.9, mAP=31.7),
    YOLOv5m=dict(speed=9.4, mAP=37.1),
    YOLOv5l=dict(speed=14.0, mAP=39.9),
    YOLOv5x=dict(speed=24.1, mAP=41.4),
)

sparseinst_640max = dict(
    r50vd_dcn_giam=dict(speed=16.5, mAP=35.5),
    r50vd_giam=dict(speed=15.9, mAP=34.0),
    r50vd=dict(speed=15.5, mAP=32.58),
)

sparseinst_640min = dict(
    r50vd_dcn_giam=dict(speed=26.4, mAP=37.7),
    r50vd_giam=dict(speed=25.3, mAP=35.6),
    r50vd=dict(speed=24.7, mAP=34.1),
)

solov2_640max = dict(
    r50=dict(speed=31.7, mAP=28.9),
    r101=dict(speed=37.5, mAP=31.14),
)

solov2_640min = dict(
    r50=dict(speed=44.7, mAP=32.5),
    r101=dict(speed=54.5, mAP=34.8),
)

colors = ["#1f77b4", "#ff7f0e", "#2ca02c", "#7E2F8E", "#A2142F"]
names = ["YOLOv5-seg", "sparseinst_640min", "sparseinst_640max", "solov2_640min", "solov2_640max"]
results = [yolov5_seg, sparseinst_640min, sparseinst_640max, solov2_640min, solov2_640max]
fig2, ax2 = plt.subplots(1, 1, figsize=(8, 4.25), tight_layout=True)
for i, result in enumerate(results):
    ax2.plot(
        [value["speed"] for _, value in result.items()],
        [value["mAP"] for _, value in result.items()],
        ".-",
        linewidth=2,
        markersize=10,
        label=f"{names[i]}",
        color=f"{colors[i]}",
    )
    for k, v in result.items():
        print(k)
        plt.text(
            v["speed"] - 0.5,
            v["mAP"],
            k,
            fontsize=12,
            # style="italic",
            weight="light",
            # verticalalignment="center",
            horizontalalignment="right",
            # rotation=45,
            color=f"{colors[i]}",
        )

ax2.grid(alpha=0.2)
ax2.set_yticks(np.arange(20, 60, 5))
ax2.set_xlim(0, 60)
ax2.set_ylim(25, 43)
ax2.set_xlabel('PyTorch FP16 RTX3060 Latency (ms/img)')
ax2.set_ylabel('COCO Mask AP val')
ax2.set_title('YOLOv5 v7.0: SOTA Realtime Instance Segmentation')
ax2.legend(loc='lower right')
f = 'study.png'
print(f'Saving {f}...')
plt.savefig(f, dpi=300)
plt.show() |

Signed-off-by: Glenn Jocher <glenn.jocher@ultralytics.com>
for more information, see https://pre-commit.ci
Signed-off-by: Glenn Jocher <glenn.jocher@ultralytics.com>
Signed-off-by: Glenn Jocher <glenn.jocher@ultralytics.com>
|
Hello @glenn-jocher, Congratulation for releasing the v7.0. Thanks |
|
@MSutt oh of course, thanks for the reminder! |
|
@MSutt all 3 release images pushed to DockerHub now :)
|

|
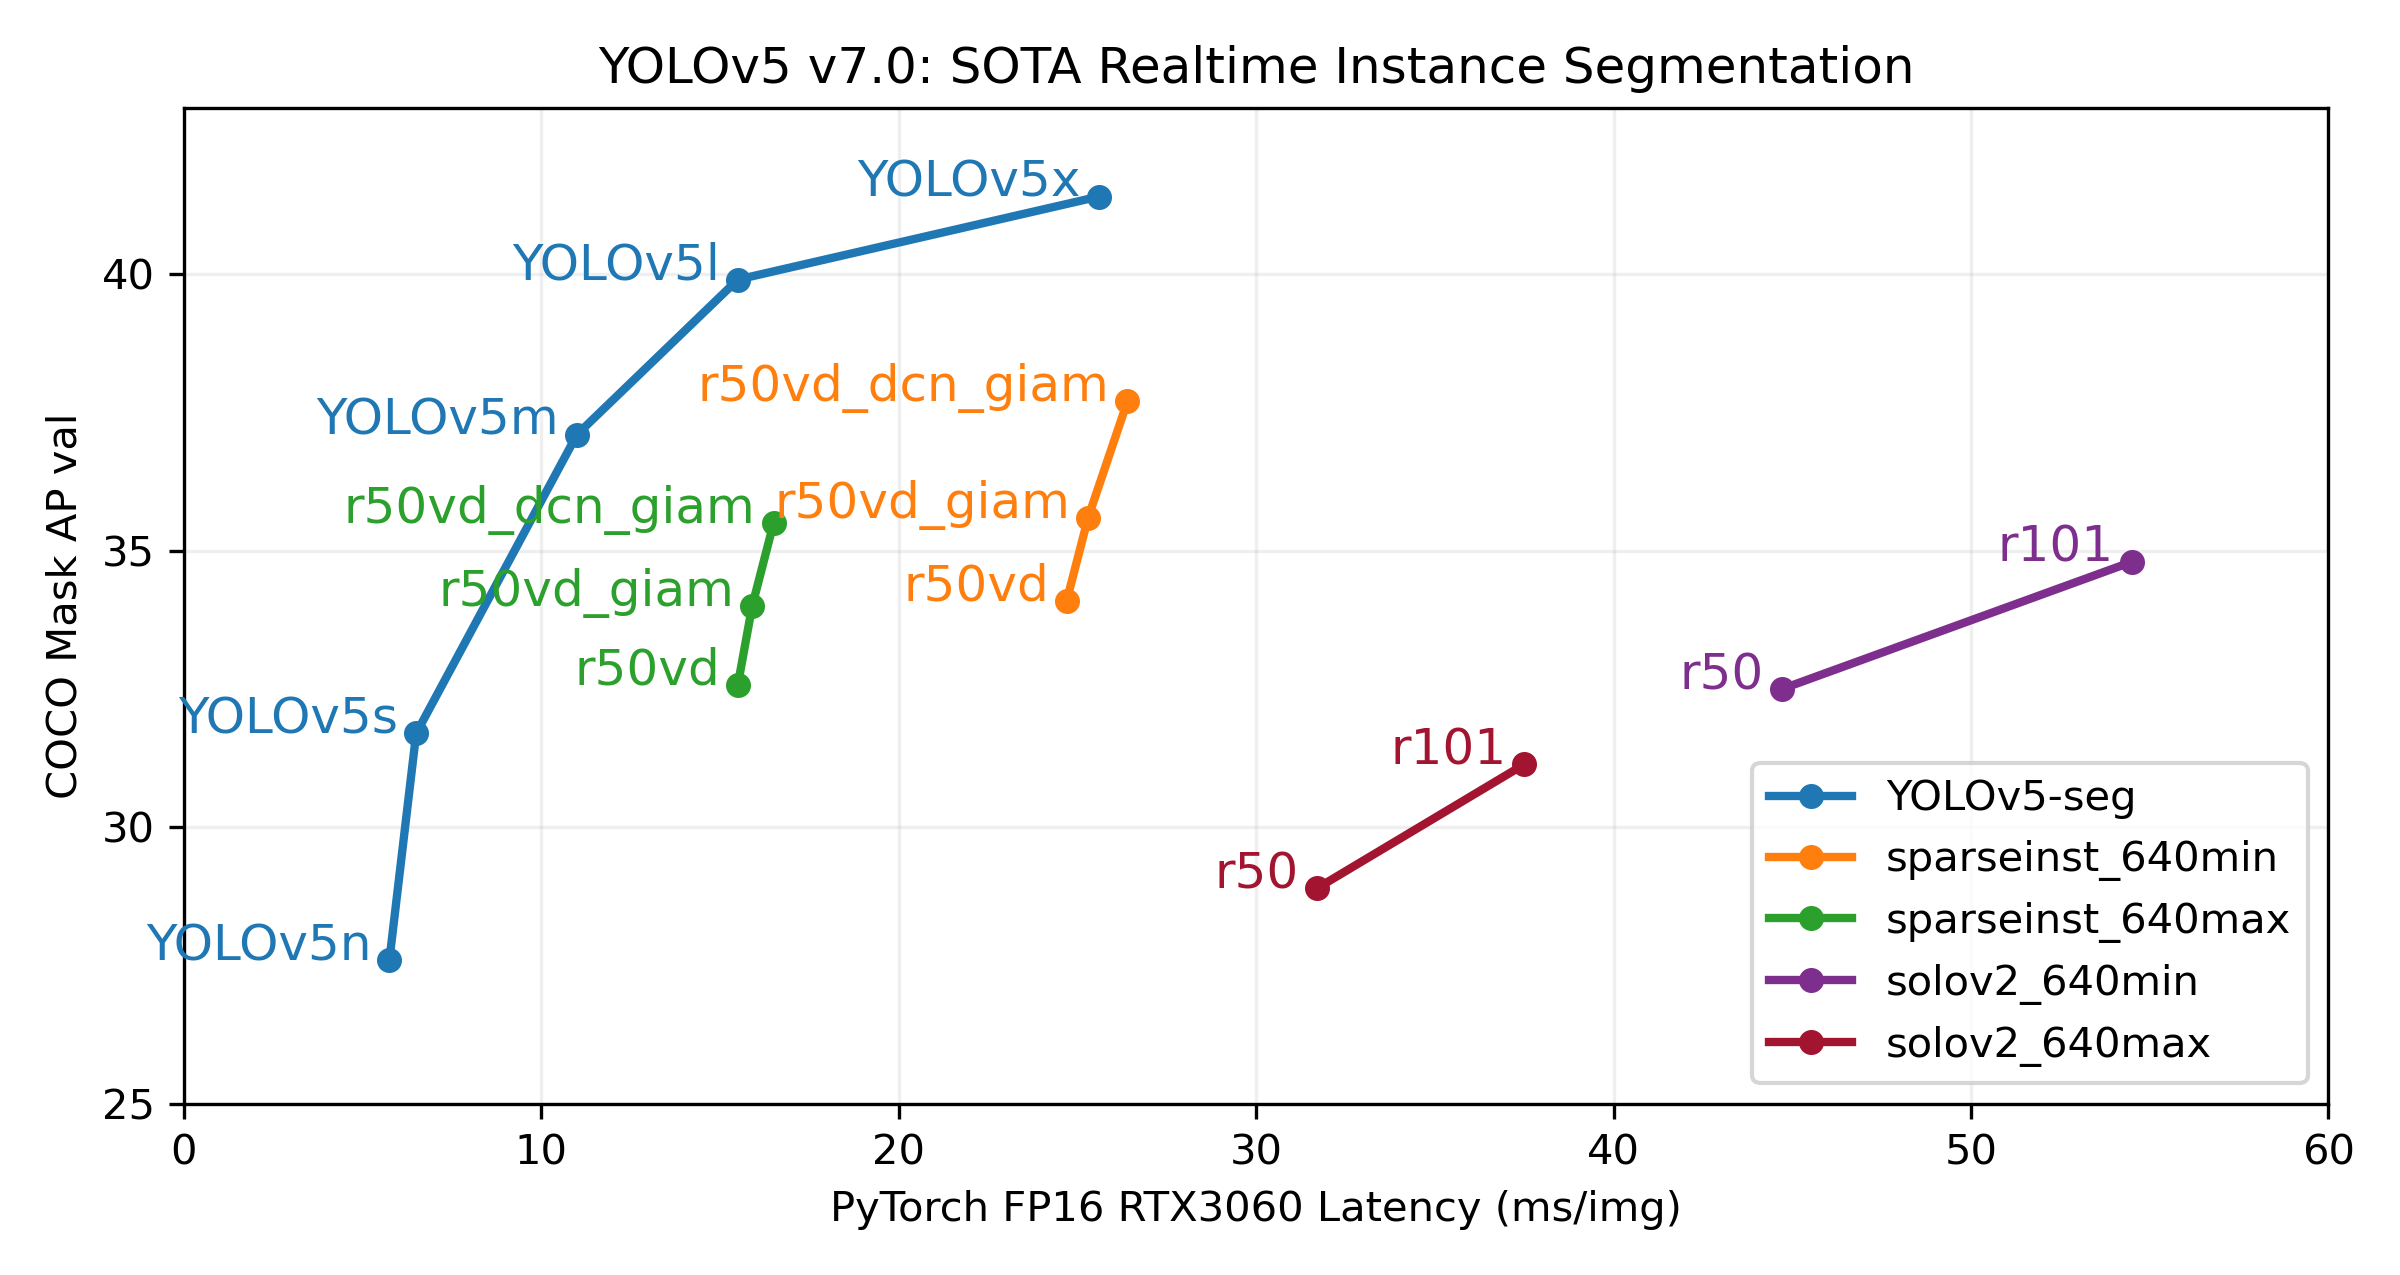
@glenn-jocher @AyushExel updated the chart. with dt[2]:
preds = non_max_suppression(preds,
conf_thres,
iou_thres,
labels=lb,
multi_label=True,
agnostic=single_cls,
max_det=max_det,
nm=nm)
# add this to include processing time
for i, det in enumerate(preds): # per image
if len(det):
_ = process_mask(protos[i], det[:, 6:], det[:, :4], im[i].shape[1:], upsample=True) # HWCAnd I found their # modified val.py to only test 640 case.
python segment/val.py --data coco.yaml --iou-thres 0.7 --batch-size 1 --half \
--weights weights/yolov5n-seg.pt weights/yolov5s-seg.pt weights/yolov5m-seg.pt weights/yolov5l-seg.pt weights/yolov5x-seg.pt\
--task study\
--max-det 100import matplotlib.pyplot as plt
import numpy as np
yolov5_seg = dict(
YOLOv5n=dict(speed=5.75, mAP=27.6),
YOLOv5s=dict(speed=6.5, mAP=31.7),
YOLOv5m=dict(speed=11.0, mAP=37.1),
YOLOv5l=dict(speed=15.5, mAP=39.9),
YOLOv5x=dict(speed=25.6, mAP=41.4),
)
sparseinst_640max = dict(
r50vd_dcn_giam=dict(speed=16.5, mAP=35.5),
r50vd_giam=dict(speed=15.9, mAP=34.0),
r50vd=dict(speed=15.5, mAP=32.58),
)
sparseinst_640min = dict(
r50vd_dcn_giam=dict(speed=26.4, mAP=37.7),
r50vd_giam=dict(speed=25.3, mAP=35.6),
r50vd=dict(speed=24.7, mAP=34.1),
)
solov2_640max = dict(
r50=dict(speed=31.7, mAP=28.9),
r101=dict(speed=37.5, mAP=31.14),
)
solov2_640min = dict(
r50=dict(speed=44.7, mAP=32.5),
r101=dict(speed=54.5, mAP=34.8),
)
colors = ["#1f77b4", "#ff7f0e", "#2ca02c", "#7E2F8E", "#A2142F"]
names = ["YOLOv5-seg", "sparseinst_640min", "sparseinst_640max", "solov2_640min", "solov2_640max"]
results = [yolov5_seg, sparseinst_640min, sparseinst_640max, solov2_640min, solov2_640max]
fig2, ax2 = plt.subplots(1, 1, figsize=(8, 4.25), tight_layout=True)
for i, result in enumerate(results):
ax2.plot(
[value["speed"] for _, value in result.items()],
[value["mAP"] for _, value in result.items()],
".-",
linewidth=2,
markersize=10,
label=f"{names[i]}",
color=f"{colors[i]}",
)
for k, v in result.items():
print(k)
plt.text(
v["speed"] - 0.5,
v["mAP"],
k,
fontsize=12,
# style="italic",
weight="light",
# verticalalignment="center",
horizontalalignment="right",
# rotation=45,
color=f"{colors[i]}",
)
ax2.grid(alpha=0.2)
ax2.set_yticks(np.arange(20, 60, 5))
ax2.set_xlim(0, 60)
ax2.set_ylim(25, 43)
ax2.set_xlabel('PyTorch FP16 RTX3060 Latency (ms/img)')
ax2.set_ylabel('COCO Mask AP val')
ax2.set_title('YOLOv5 v7.0: SOTA Realtime Instance Segmentation')
ax2.legend(loc='lower right')
f = 'study.png'
print(f'Saving {f}...')
plt.savefig(f, dpi=300)
plt.show()This chart includes the time of mask processing. Actually I don't think this 1~2 ms matters, but in case users will ask about it so I commented the speed results here. |
|
@Laughing-q got it. Thanks! |
|
@glenn-jocher remember to update the image on readme with this ^^ |
@AyushExel @Laughing-q updated plot here in README

Addresses #10245 (comment)

Signed-off-by: Glenn Jocher <glenn.jocher@ultralytics.com>
@AyushExel @Laughing-q updated plot here in README

Addresses #10245 (comment)

Signed-off-by: Glenn Jocher <glenn.jocher@ultralytics.com>

Signed-off-by: Glenn Jocher <glenn.jocher@ultralytics.com>
|
@Laughing-q thanks! I've fixed our plot in #10344 |
🛠️ PR Summary
Made with ❤️ by Ultralytics Actions
🌟 Summary
Updated READMEs, tutorials, and weight download scripts to align with the new YOLOv5 v7.0 release.
📊 Key Changes
🎯 Purpose & Impact